Degrees of Freedom
Lead Author(s): ErikGregory
Definition of Degrees of Freedom
To perform t-tests we often need to determine the number of degrees of freedom in our observations to determine the probability of a particular t statistic. The mathematical explanation of what degrees of freedom are tends to elude most but mathematicians because it requires some background in linear algebra.
The simple definition of degrees of freedom is "the number of items free to vary in the final calculation of a test statistic \xB9."
Another convenient way to think of degrees of freedom is as "the minimum number of items we need to determine the rest of the items, given some already-determined parameter which is calculated using those items."
Determining Degrees of Freedom
For Estimating Variance:
So for example, say we have a sample of size N and want to estimate the variance of the N observations. In order to do so, we use the formula:
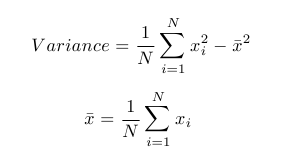 So how many variables are used in the final calculation of the variance? We can interpret the sample mean as a constant in this case since it is calculated using the same observations as the variance is. Suppose we had N-1 of the "x's" and knowledge of the variance. In this case then, we could use the already-determined information to find what the final "x" value is (by doing some simple algebra). Thus, there are N-1 degrees of freedom since knowing any fewer of the observations would make it impossible to calculate the sample variance.
In Comparison of Sample Means:
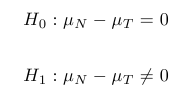
Consider height measurements of two random samples of size "N" and "T" from New York City, NY and Turlock, CA, respectively. Suppose we calculate the sample means and obtain two different values, and we want to determine if there is a difference in the population means of the two samples or if the difference can be attributed to chance.
NOTE: There is an underlying assumption that the variances of the populations are equal in this case.
So our hypotheses are:
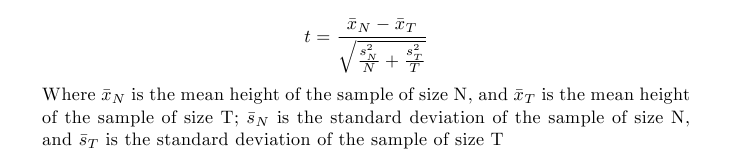
 And we calculate our test statistic as follows:
 So we have assumed that our sample means are independent, and we know their values. In determining the number of degrees of freedom, we observe that to calculate the sample mean heights (and standard deviations) for New York City and Turlock there are N-1 and T-1 height measurements that are free to vary (degrees of freedom), respectively. So in total, we have (N-1)+(T-1) = N+T-2 measurements that are free to vary in our calculation of "t." So there are N+T-2 degrees of freedom.
Chi-Square Tests:
In doing Chi-Square tests we often need to determine the number of degrees of freedom. The calculation to determine degrees of freedom in these cases is conveniently explained in tabular form.
Suppose we are doing a chi-square and need to determine what to put in the "expected" portion of our table. We already have observed values, and so we have the "Totals" entries filled in but need to figure out what to put in the "expected" entries.
| |
Category A |
Category B |
Category C |
Totals |
| Condition 1 |
|
|
|
33 |
| Condition 2 |
|
|
|
33 |
| Condition 3 |
|
|
|
34 |
| Totals |
25 |
25 |
50 |
100 |
The problem then, is plugging in values for the other spaces. Suppose we have some method of determining the number of people we are able to fill in the following 4 entries:
| |
Category A |
Category B |
Category C |
Totals |
| Condition 1 |
8 |
|
20 |
33 |
| Condition 2 |
8 |
|
|
33 |
| Condition 3 |
|
|
6 |
34 |
| Totals |
25 |
25 |
50 |
100 |
It may seem like we have little to work with at this point, but it turns out we have all of the information we need to solve the problem. For example, Category C/Condition 2 must be 50-(20+6)= 24, and Category A/Condition 3 must be 25-(8+8) = 9 Similarly, we can fill in all of the entries in the table- using this information only- as follows.
| |
Category A |
Category B |
Category C |
Totals |
| Condition 1 |
8 |
5 |
20 |
33 |
| Condition 2 |
8 |
1 |
24 |
33 |
| Condition 3 |
9 |
19 |
6 |
34 |
| Totals |
25 |
25 |
50 |
100 |
If we had just one fewer expected entries determined in advance, we would not be able to fill in the rest of the table. Thus, the degrees of freedom of a Chi-Square distribution is the minimum number of entries we can fill in before we can fill in the rest of the table- which, in this case, is 4.
In any table such as this, the degrees of freedom can be determined by simply using the formula:
Degrees of freedom = (R-1)*(C-1)
Where "R" is the number of rows representing different categories (not counting the "totals" row) we have to fill in, and "C" is the number of columns (not counting "totals") that we have to fill in. In our case this is (3-1)*(3-1) = 2*2 = 4, which is what we expect.
References:
[\xB9] http://www.animatedsoftware.com/statglos/sgdegree.htm
http://www.jerrydallal.com/LHSP/dof.htm
http://onlinestatbook.com/chapter8/df.html

