

| I | Attachment | Action | Size | Date | Who | Comment |
|---|---|---|---|---|---|---|
| |
|
manage | 59 K | 25 Jun 2012 - 05:03 | UnknownUser |
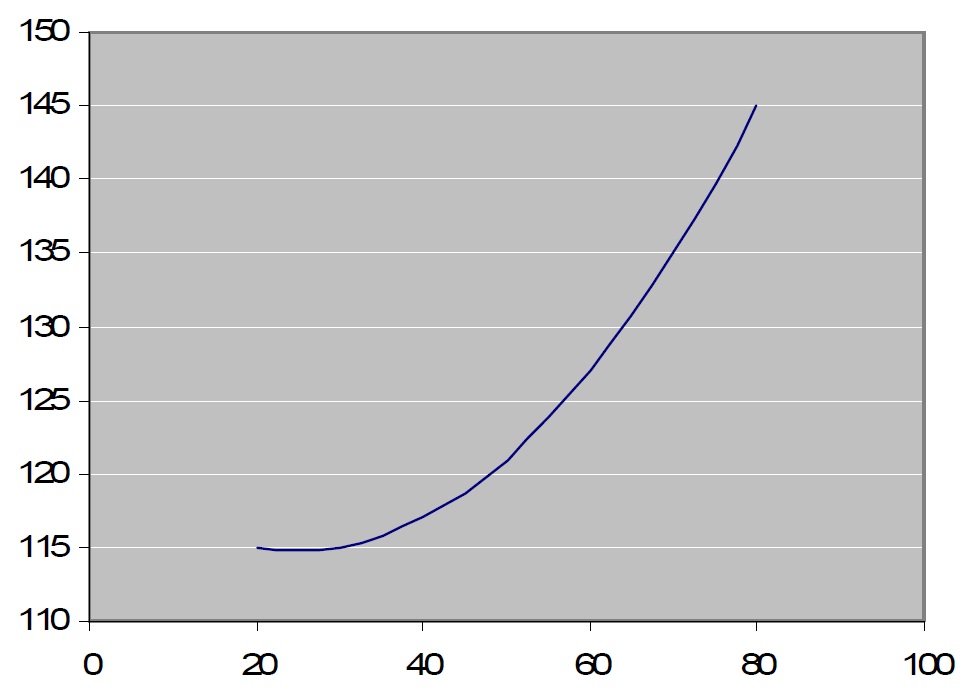 The order of polynomial to use, quadratic, cubic, quartic, etc., can be decided by adding higher order terms one by one until the additional term no longer has a P-value below a specified cutoff value (usually 0.05), or by other statistical methods for variable selection.
Alternative approaches to modeling non-linear effects of a predictor are linear splines or breaking the predictor into categories.
See also: the polynomial model used in scatterplots.
The order of polynomial to use, quadratic, cubic, quartic, etc., can be decided by adding higher order terms one by one until the additional term no longer has a P-value below a specified cutoff value (usually 0.05), or by other statistical methods for variable selection.
Alternative approaches to modeling non-linear effects of a predictor are linear splines or breaking the predictor into categories.
See also: the polynomial model used in scatterplots.
| I | Attachment | Action | Size | Date | Who | Comment |
|---|---|---|---|---|---|---|
| |
|
manage | 59 K | 25 Jun 2012 - 05:03 | UnknownUser |