| Title | Contributor/Email | Date Last Modified |
|---|---|---|
| Scatterplots and Bivariate Density Plots | Richard Forshee (email: Richard.Forshee@fda.hhs.gov) | 21 Jun 2012 - 16:30 |
| Line Plot | fabrice.bancken@novartis.com | 19 Jun 2012 - 18:44 |
| Basic Histogram | Richard Forshee (email: Richard.Forshee@fda.hhs.gov) | 19 Jun 2012 - 18:41 |
| Dot plots | Mat Soukup (email: Mat.Soukup@fda.hhs.gov) | 19 Jun 2012 - 18:41 |
| Why Not to Use Pie Charts for Communicating Resultshem | Mark K Jones, Amadeus Software Ltd (formerly GlaxoSmithKline) and Susan Duke (email: susan.p.duke@gsk.com) | 19 Jun 2012 - 18:41 |
| Title | Graph-Overview | Contributor/Email | Reference Image |
|---|---|---|---|
| [[ArchiveGraphics][]] | |||
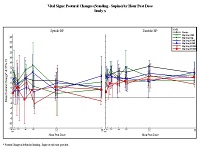
| Vital Signs: Postural Change by Time and Treatment | Rich Anziano (Richard.J.Anziano@Pfizer.com) | |
|
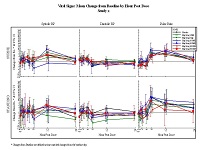
| Vital Signs: Mean Change by Time and Treatment | Rich Anziano (Richard.J.Anziano@Pfizer.com) | |
| Figure No. | Contributor/Email | Question Classification | Reference Image |
|---|---|---|---|
| Figure 02_AE | QiJiang | II-Incidence of AE:1_Types of AE (treatment vs comparators or different dosage), II-Incidence of AE:2_Incidence rate or ratio | 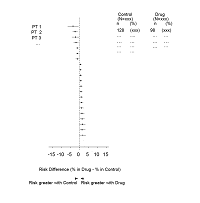 |
| Figure 05_AE | QiJiang | II-Incidence of AE:1_Types of AE (treatment vs comparators or different dosage), V!-Withdraw and Interruption in Relation to the Occurrence of AEs | 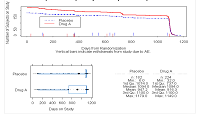 |
| Figure 06_AE | QiJiang | III-AE Occurrence Over Time:1_Time to onset (treatment vs comparator) | 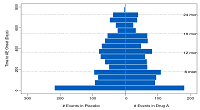 |
| Figure 07_AE | QiJiang | III-AE Occurrence Over Time:2_Trends of AE occurrence over time | 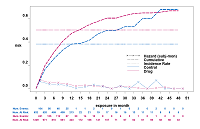 |
| Figure 08_AE | QiJiang | II-Incidence of AE:1_Types of AE (treatment vs comparators or different dosage) | 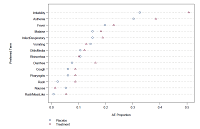 |
| Figure 09_AE | QiJiang | II-Incidence of AE:1_Types of AE (treatment vs comparators or different dosage) | 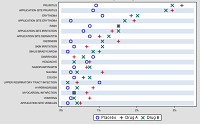 |
| Figure 10_AE | II-Incidence of AE:1_Types of AE (treatment vs comparators or different dosage) |  |