Small Samples:
--Main.ErikGregory - 27 Jul 2010
Suppose you are planning (or maybe have already completed) a study to determine the effectiveness of some new drug or treatment on some condition. Unfortunately, you determine that you can/have only attain(ed) a relatively small sample for your study.
The line between a small sample size and a sufficiently large sample size is a vague one. For instance, if you are testing the theory that a teaspoon of Arsenic will cause death (this is a gross hyperbole of an example) in rats you will probably have a good idea of how many rats in your test group will die compared to in your control group. In cases such as this (or less exaggerated cases) a small sample size of about 4 mice per group will probably be sufficient to determine statistical significance. However, it can be shown probabilistically that very little or no statistical significance can be demonstrated using sample sizes as small as 6 - even in the presence of an all-or-nothing response [Mercy, \xB9]. The essence of this argument is that the arrangement of the outcomes as all successes in one group and all failures in another may be attributable to chance alone.
In contrast, suppose you're doing a study to determine the effectiveness of chemotherapy in reducing the size of tumors versus the effectiveness of some new treatment drug. In this case, 4 mice per group may be sufficient to demonstrate that chemotherapy is more effective than the drug - provided we have an all-or-nothing response . The all-or-nothing response would be the case where each of the rats in the chemotherapy group showed reduction in tumor size, while each of the rats in the group that received the new drug did not. However, it is likely that there will be no grounds to reject our null hypothesis that the drug and chemotherapy are equally effective in reducing tumor size if we do not have all-or-nothing results.
Ethical Considerations
(For newer and more detailed discussion, see here.)
It is commonly accepted in the scientific community that research should only be performed if the potential benefits outweigh the potential cost to society [Prentice, Ethics and Sample Size]. So in the case when we have a small sample and minimal grounds to anticipate an all-or-nothing response, it would likely be difficult to demonstrate that the potential benefits outweigh the potential costs, and the study should probably not be performed at all unless a sufficient number of test subjects can be attained. By a "sufficient number" of test subjects, we mean a number of subjects which will probably produce some statistically significant result regardless of whether an all-or-nothing response occurs.
Also, in the case of testing whether Arsenic is in fact deadly to rats the ethical consideration comes from how sure we already are that it is deadly. In this case, it could be argued that using such a small sample size is well-defended by our anticipation of an all-or-nothing response. Conversely, it could be argued that the case when we are already virtually sure of the outcome (when it causes harm) is grounds to not perform the study at all. These considerations should be made before doing a study with a small sample.
Why 3 Mice Per Group Is Too Few for Nonparametric Methods
Suppose we are trying to determine whether Drug A reduces the time it takes to recover from a particular flu virus in mice. Our study design involves a control group of 3 mice that are positive for the virus and do not receive Drug A, and a test group that are positive for the virus and do receive Drug A.
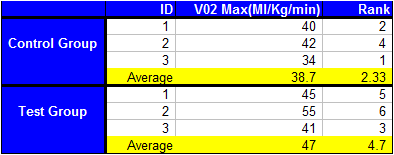
Unfortunately the means we measure for the two groups happen to be too similar to draw out any real significance using parametric methods, but we happen to notice that the 3 mice in the control group all experienced symptoms for longer than each of the 3 mice in the test group. Thus, we decide to rank the lengths of time that the mice experienced flu symptoms (1 being the longest duration, 6 being the shortest).
So in the control group, we have the mice of ranks "1", "2", and "3" - in the test group we have the mice of ranks "4", "5", and "6". Thus, it appears to be significant that all of the mice in the test group experienced a shorter time of flu symptoms than those in the control group. However, it can be easily demonstrated that this is not the case.
Our null hypothesis is, in this case, that there is no difference between the mean rank of the control group and the mean rank of the test group. Thus, we use a 2-tailed t-test to determine the probability of achieving our results purely by chance.
We wish to calculate the probability that - purely by chance - we would choose the 3 mice who lasted the longest to be the mice in the test group. The calculation goes as follows:
We can choose any of the 3 mice with the highest rank for our first mouse ( 3 out of 6), any of the 2 remaining highest ranks of 5 mice for our second mouse(2 out of 5), and finally the remaining mouse of rank four or higher for our third mouse (1 out of 4). Thus, the probability of choosing those 3 mice is simply (3/6)*(2/5)*(1/4) = 1/20 = 0.05. However, since we are dealing with two different groups of mice we double this probability - because we are determining the probability that this combination of 3 mice would have been chosen for either of our two groups, which turns out to be 2(0.05) = 0.10. Thus, the t-test admits that the arrangement of mice could have occurred purely by chance in 10 percent of repeated random selections. This p-value is generally not taken to be a statistically significant one.
Despite the inability to reject our null hypothesis at any commonly accepted level, 0.10 probability is "relatively" small. Attaining results at this significance level may not be grounds to draw a conclusion about some population, but may be sufficient grounds to justify further study of this phenomenon. Thus, there is some value to our data and our study because it is a good indicator that we may be able to achieve statistical significance in a larger study.
Parametric or Non-Parametric Analysis
It is a common misconception that anytime one deals with relatively small samples non-parametric analysis should be used. In reality, the decision to do parametric analysis of data from a small sample versus non-parametric analysis depends on how many assumptions we want to make about our data.
Suppose we are trying to determine if there is a difference between two population means. The assumptions to do Parametric versus Nonparametric analysis are:
Parametric:
1. The observations are independent of each other
2. There is an underlying distribution to the data (normal, binomial, etc.)
3. The variances from each population mean are equal
Nonparametric:
1. The observations are independent of each other
2. The populations do not differ in dispersion (variance), but merely where they are centered about (their means).
In general the decision to choose to use non-parametric analysis depends on whether we can assume a distribution in the population or not. Parametric statistics have more statistical power, in general, in the case when we know the underlying distribution of the data. Conversely, non-parametric statistics tend to have more power when we have no knowledge of, or suspect there is no underlying known distribution to the data -- which is often the case when we have a small sample size. However, there can be significant loss of statistical power if we use non-parametric statistics to analyze data that have an underlying distribution (whether we know what that distribution is or not), so the decision to use non-parametric methods should be made with caution.
Note: There are special cases in which we are more concerned about the order of data than the distribution of the data. In these cases, non-parametric statistics are usually simpler to use in analysis since they do not take into account the spread of the distribution, but only the ordering.
References:
\xB9 http://www.childrens-mercy.org/stats/category/AskProfessorMean.asp
http://www.statsoft.com/textbook/nonparametric-statistics/
http://www.ncbi.nlm.nih.gov/pmc/articles/PMC153434/
Ross Prentice: Ethics and Sample Size - Another View, American Journal of Epidemiology, Copyright 2005, John Hopkins Bloomberg School of Public Health

